Product Analytics is the most significant assistant of the product teams in the decisions to be made about the product. Creating a Product Analytic Dashboard is crucial for every SaaS product. As Peter Drucker said, “a manager must be able to measure performance and results against the goal. ” Using product analytics, we can understand why users behave the way they do.
As Producter, we believe data should be considered in our every decision. In addition to this, we need to learn how these decisions affect our product. The data should also be kept in order. If it’s not, you will get lost in the data or the data will lead you to wrong conclusions.
Keeping data organized can be made more accessible with dashboards. A dashboard is a page that shows metrics related to each other. A product metric is a data that shows how users interact with a product and how that relates to a company’s bottom line. It is necessary to use different dashboards and metrics according to their topics.

Product Analytic tools that we use
We use 3 tools in Product Analytics. They are Heap, Metabase, and Hotjar.
In Metabase, we usually look at common numbers for us such as how many workspaces have been created, and how much feedback has been created. For specific product-related insights, we create events in Heap. We are helped greatly here by the fact that Heap brings us historical data as well.
Using Hotjar, on the other hand, we can analyze user behavior and draw conclusions. When using Hotjar, it is useful not to decide based on a single session.
Critical things to consider in the Product Analytics
First of all, you need to determine which metrics to include in the dashboard. As a matter of fact, the North Star metric should be at the top, and it should be the first metric you consider.

North-Star is the metric that will show the company’s long-term growth, and all other metrics will affect this metric, which is the most vital metric. As Producter’s North Star Metric, we chose Weekly Active Users.
Besides the metrics, you should check this dashboard frequently. However, do not check too often. You will suffer in the long run if you do this. For frequently changing metrics, it is usually sufficient to review them every morning, and for others, it is sufficient to review them twice every week.
Share these dashboards with your entire team, no matter what company structure you have. Keep these dashboards in a place where your team can always access and control them whenever they want. According to Harvard Business Review, a company with a high level of harmony with its employees is twice as likely to succeed.
Analyzing Metrics
There is no point in just looking at the metrics. It is also necessary to analyze these numbers, think about them, and discuss them.
Each Saturday morning, Producter’s product team looks at the dashboards and makes decisions about the product. In addition, we analyze how previous weeks’ actions have affected the numbers. As well, the entire team meets on the last day of every month to evaluate our performance against the targets.
Conclusion
Every product-driven company should use Product Analytics, as we discussed above. Additionally, learning Product Analytics on a regular basis is necessary to gain a deeper understanding. Product Analytics is not something you can learn in a day or two. The process is long, but the benefits are at least as great.
For more about Product Analytics:
- 5 Key Metrics Every Product-Led Company Must Track
- What B2B metrics should you start with?
- Product Glossary: Customer Retention
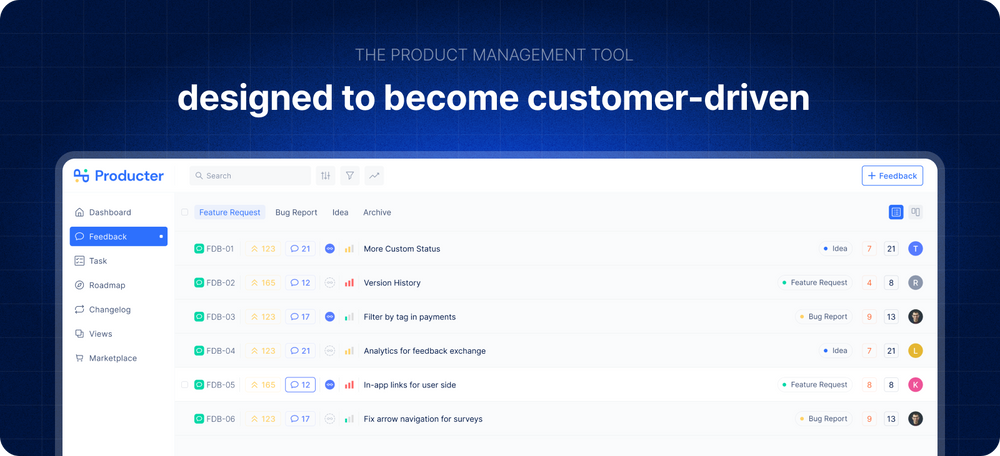
Producter is a product management tool designed to become customer-driven.
It helps you collect feedback, manage tasks, sharing product updates, creating product docs, and tracking roadmap.


